 Kevin Smith
1 min read
How to Develop Marketing KPIs That Actually Matter
Last updated: February 2026 | Originally published: September 2023
![Why Your CFO Doesn't Trust Marketing & How to Fix It [Free Template]](https://www.mightyroar.com/hubfs/CMO%20CFO%20Budget%20Meeting.jpg)
Build trust with your CFO by replacing scattered marketing metrics with a focused measurement system: pick 1-2 conversion events finance already uses (like sales-qualified opportunities or completed purchases), layer simple first/last-touch attribution with targeted incrementality tests, and stand up a monthly pipeline dashboard that shows marketing's contribution to revenue, CAC trends, and ROI in one place.
Less than a quarter of marketers say they're fully aligned with their CFO on metrics and budgets, and only about a third of finance leaders describe their relationship with the CMO as "highly collaborative." That gap exists because CMOs focus on engagement dashboards, while CFOs prioritize unit economics and payback periods. Your CFO isn't asking for perfect attribution; they want clear definitions of success and a direct line from marketing spend to pipeline and revenue.
CFOs look at marketing as a capital investment, not a creative exercise. They care about customer acquisition cost, marketing's contribution to pipeline, and the return on each incremental dollar.
They want you to show how spend supports profitable growth using KPIs that plug directly into financial models: revenue per marketing dollar, CLTV, and incremental revenue.

The disconnect happens when CMOs bring dashboards full of engagement metrics while finance is looking for unit economics and payback periods. Organizations where CMOs and CFOs co-own ROI metrics are far more likely to improve marketing efficiency and optimize budgets over time.
Your job then becomes building a measurement system that closes this gap, without needing an entire data science department to run it.
Stop spreading attribution efforts across a dozen micro-conversions, such as email opens, social engagements, and other metrics that don't show up in a revenue conversation.
Instead, choose one or two moments in the journey that directly align with the business goals. For B2B teams, that typically means events like "sales-qualified opportunity created," "sales-accepted meeting held," or "proposal sent." For B2C, it might be "purchase completed," "subscription started," or "free trial converted"—moments that directly correlate with revenue and are already tracked in your CRM or e-commerce platform.
These should be events your CFO recognizes and uses in forecasts or board reports. Not metrics that need a five-minute explanation before anyone nods along.
Simple rule: if it doesn't show up in pipeline reviews or revenue projections, it probably shouldn't be your primary attribution target.
You can use an earlier event (like a high-intent form fill) for day-to-day optimization, but your north star needs to sit closer to revenue.
Perfect multi-touch attribution sounds great. However, most mid-market teams don't have the data quality, tracking completeness, or analytical resources to run those models with any real confidence.
You can capture most of the strategic value by combining simple first- and last-touch with targeted incrementality experiments. That combination answers the questions CFOs actually ask: "Where did this pipeline come from?" and "What happens if we cut or double this spend?"
First-touch attribution tells you where an account first entered your funnel, such as paid social, organic search, an event, or a partner referral. Last-touch shows the final marketing interaction before your chosen conversion event, like a pricing page visit, retargeting click, email response, or demo request.
This isn’t perfect attribution, but first/last-touch is simple enough that finance and sales will actually use it, and consistent enough that you can track changes over time without rebuilding the model every quarter.
Be clear about what it does and doesn’t explain. First-touch will understate the impact of nurture and mid-funnel programs. Last-touch will over-credit the final nudge and ignore the brand and demand creation that made the deal possible in the first place. Use these views for directional questions: where pipeline tends to enter, and what tends to speed conversion. Don’t use them to claim full credit for revenue.
One rule to prevent misuse: don’t optimize budgets based on last-touch ROI alone. Treat first/last-touch as a way to identify patterns worth investigating, then validate the biggest budget decisions with incrementality experiments.
Incrementality experiments measure lift by comparing a group exposed to a campaign with a similar group that isn't. It isolates what would have happened anyway from what your marketing spend actually produced. It answers one of the CFO's favorite questions: "Did this campaign make a difference, or are we just taking credit for demand that was already there?"
A minimum viable approach to running an incrementality experiment would be to pick a major budget line, such as branded search, paid social retargeting, or a display campaign, and split audiences by geography, customer segment, or audience list. Run the program in the test group, pause or reduce it significantly in the control group for a defined period.

In practice, B2B teams need to plan for two realities. First, sales cycles are long, so you’ll often use a leading indicator, like sales-accepted meetings or sales-qualified opportunities created, as the primary readout, then confirm with pipeline value and closed-won revenue once enough time has passed.
Second, holdouts can create friction with sales if they feel like you’re “turning off demand,” so governance matters: align on the test design up front, document which accounts/regions are included, and pick a budget line where a controlled reduction won’t break field targets or create noise in the forecast.
For B2B, compare qualified opportunities, pipeline value, and closed-won revenue (or your agreed leading indicator, then revenue later). For B2C, compare conversions, average order value, and revenue per customer. Either way, the output should be decision-ready: keep, cut, scale, or run a follow-up test with a clearer hypothesis. These experiments give you defensible evidence to protect what’s working and cut what isn’t.
Attribution only matters if it changes decisions. That's why you need a single, shared pipeline dashboard that acts as the source of truth for both marketing and finance. Keep it focused on a small set of KPIs: marketing's contribution to pipeline and revenue, customer acquisition cost (CAC) trends, and ROI, not dozens of secondary metrics like impressions or engagement.
Your dashboard should answer three questions:
A monthly review using this dashboard becomes the backbone of your CMO-CFO relationship. It turns one-off budget battles into an ongoing series of joint investment decisions.

When you bring this dashboard into a budget conversation, order matters. Start with business outcomes: pipeline created, revenue influenced, CAC trends before you get into channel performance or creative insights. Then use a combination of first/last-touch and recent incrementality tests to explain why the results look the way they do and to support specific recommendations: what to cut, what to protect, and what to test with additional budget.
This approach mirrors how CFOs think about capital allocation. It makes it easier for them to align because you're speaking their language and framing marketing as a growth engine instead of a cost center. Consistent, transparent reporting and a clear test-and-learn agenda build trust over time, and that is what turns a contentious budget planning season into a collaborative process.
If you’re tired of piecing together dashboards, CRM reports, and one-off slides every month, we built a single, CFO-ready reporting template you can use. Our CMO-CFO Pipeline Dashboard helps you track pipeline, revenue, CAC, and channel performance in one place.
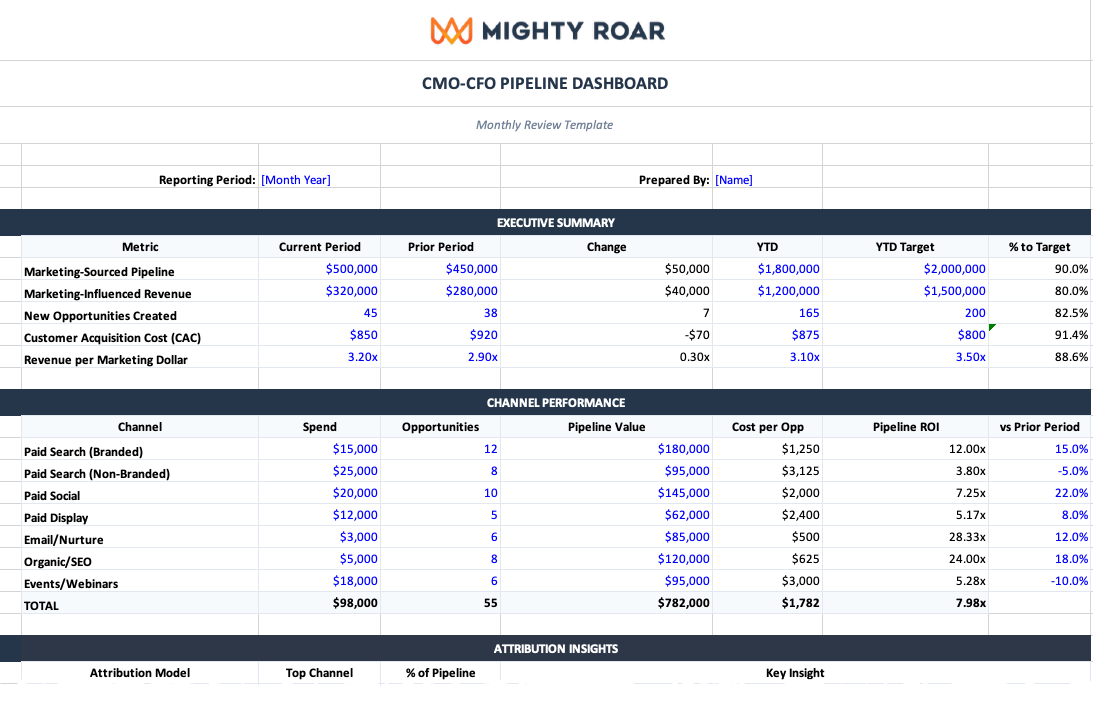
It’s an editable spreadsheet with pre-built formulas, clear metric definitions, and a monthly review structure designed to reduce debate and speed up decisions. It includes:
The goal is one spreadsheet that replaces scattered reporting and turns a marketing budget conversation into a set of investment decisions.
Most marketing teams don’t struggle because they lack data. They struggle because they don’t have shared definitions, a repeatable reporting cadence, and a measurement approach that finance will trust. That’s where we come in.
Mighty Roar helps you turn measurement into a decision-making system: we align on CFO-grade conversion events, build a simple attribution layer that holds up in executive conversations, and stand up a reporting dashboard and review cadence that drives clear decisions on what to fund, what to cut, and what to test next.
CFOs see marketing as a capital investment and want metrics that plug into financial models—customer acquisition cost, revenue per marketing dollar, and payback periods. The disconnect happens when CMOs bring engagement metrics and impressions while finance is looking for unit economics and pipeline contribution.
Focus on three areas: marketing's contribution to pipeline and revenue by channel, customer acquisition cost trends, and ROI or revenue per marketing dollar. Skip secondary metrics like impressions or email open rates—your CFO wants to see how marketing spend connects to revenue and cash flow.
Combine simple first/last-touch attribution with targeted incrementality experiments. First/last-touch shows where pipeline enters and what speeds conversion. Incrementality tests prove which campaigns actually create demand versus taking credit for it. This combination answers the questions CFOs actually ask without requiring a data science team.
Monthly. A monthly review using a shared pipeline dashboard turns budget battles into ongoing investment decisions. It builds trust over time and lets you reallocate spend before problems compound. Make it collaborative: use the meeting to co-own decisions on what to fund, cut, or test next.
Starting with channel performance or creative insights instead of business outcomes. CFOs think about capital allocation, so lead with pipeline created, revenue influenced, and CAC trends first. Then explain why results look the way they do and what you're recommending based on the data.
No. Most teams overcomplicate this. You need clear definitions of success, consistent reporting on pipeline and CAC, and a simple way to log incrementality test results. A well-structured spreadsheet with pre-built formulas works better than a complex tool that requires constant maintenance.
Cover pipeline created and revenue influenced by marketing, CAC and efficiency trends, what first/last-touch data is showing, results from recent incrementality tests, and specific budget recommendations with rationale. Keep it focused on decisions: what to protect, what to cut, and what to test with additional budget.

1 min read
Last updated: February 2026 | Originally published: September 2023

1 min read
Some researchers take a hard approach to data, either falling squarely on the side of the numbers (quantitative data) or on the other side, one of...

1 min read
While the reasons you should track your campaign URLs are clear, the correct way to use UTM codes is often not.